| Species | Refugia Score | LC Score | Refugia HA | LC HA |
|---|---|---|---|---|
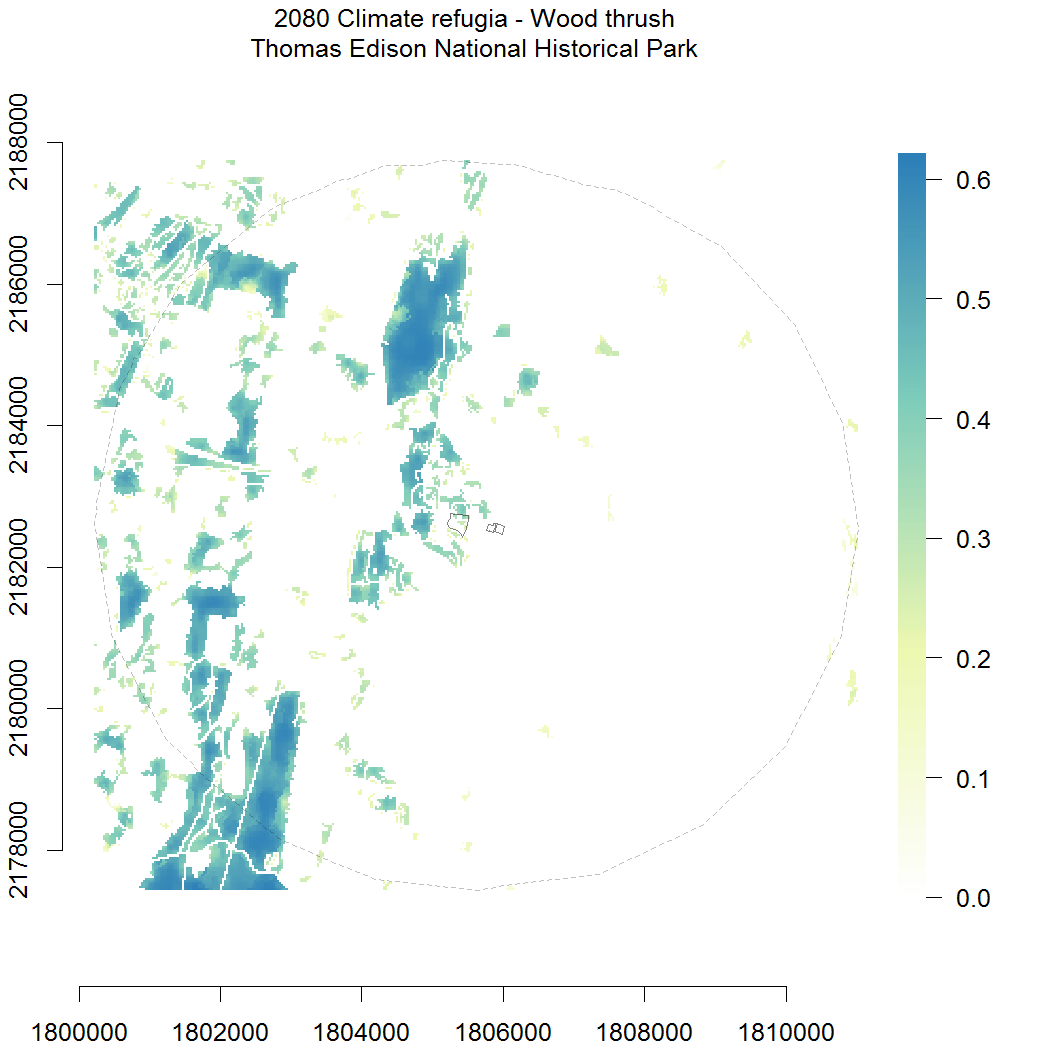
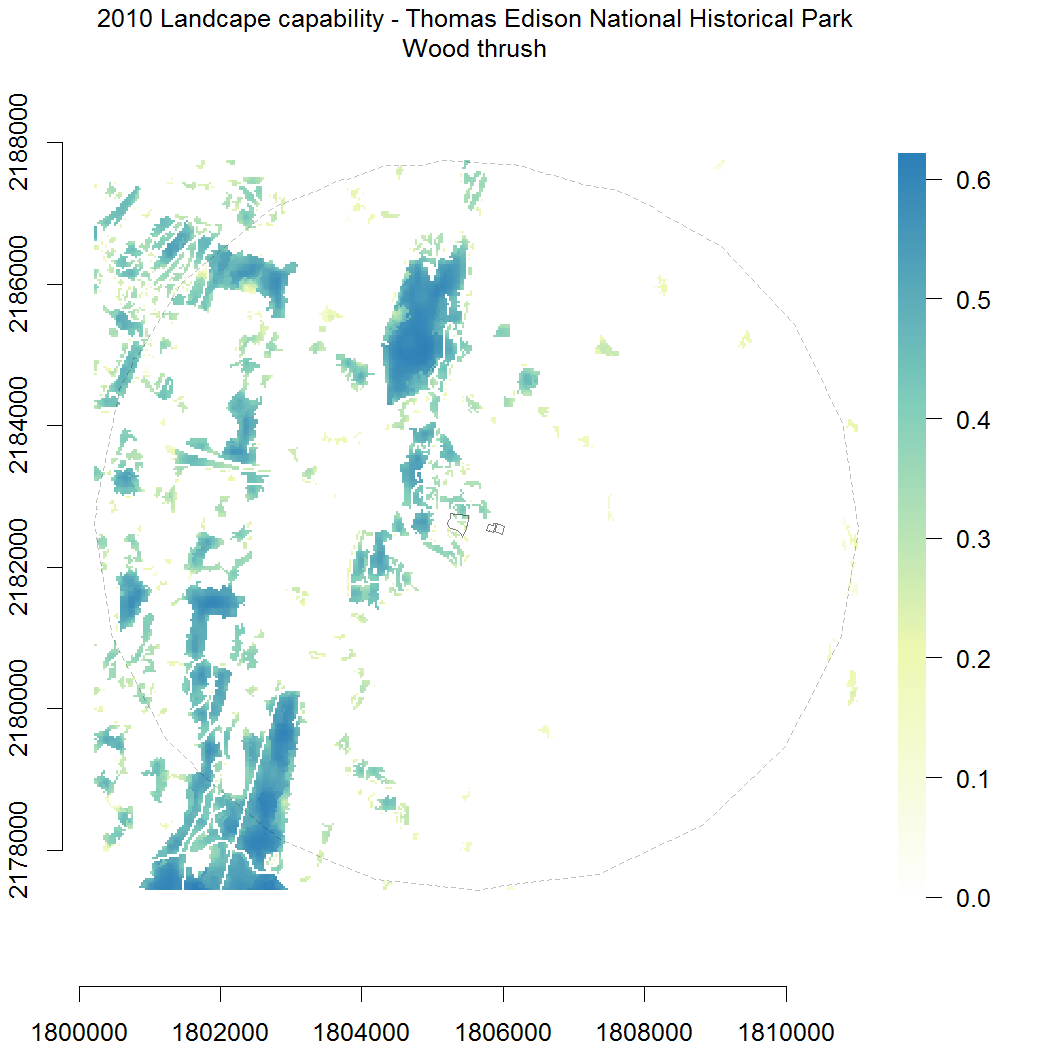
| Wood thrush | 0.2 | 0.2 | 412.7 | 415.5 |
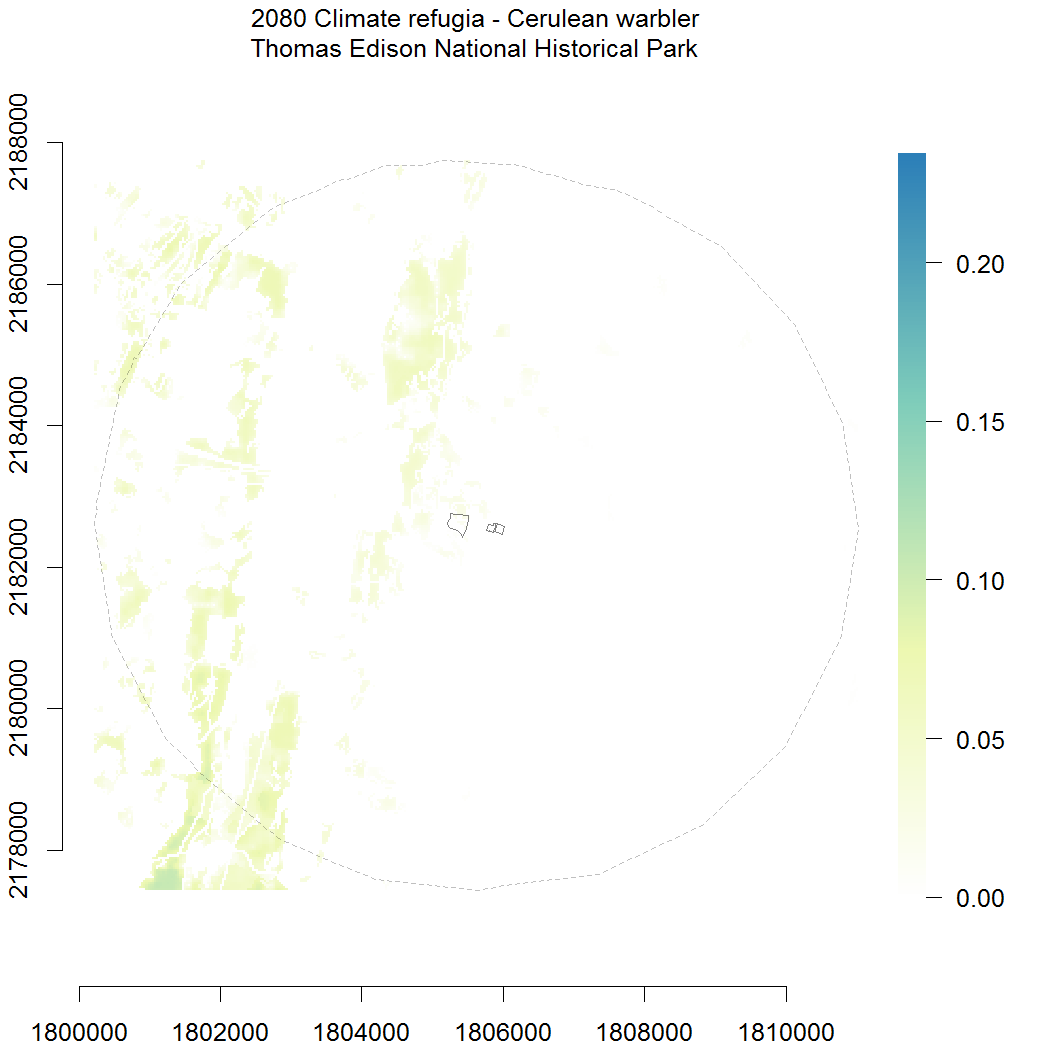
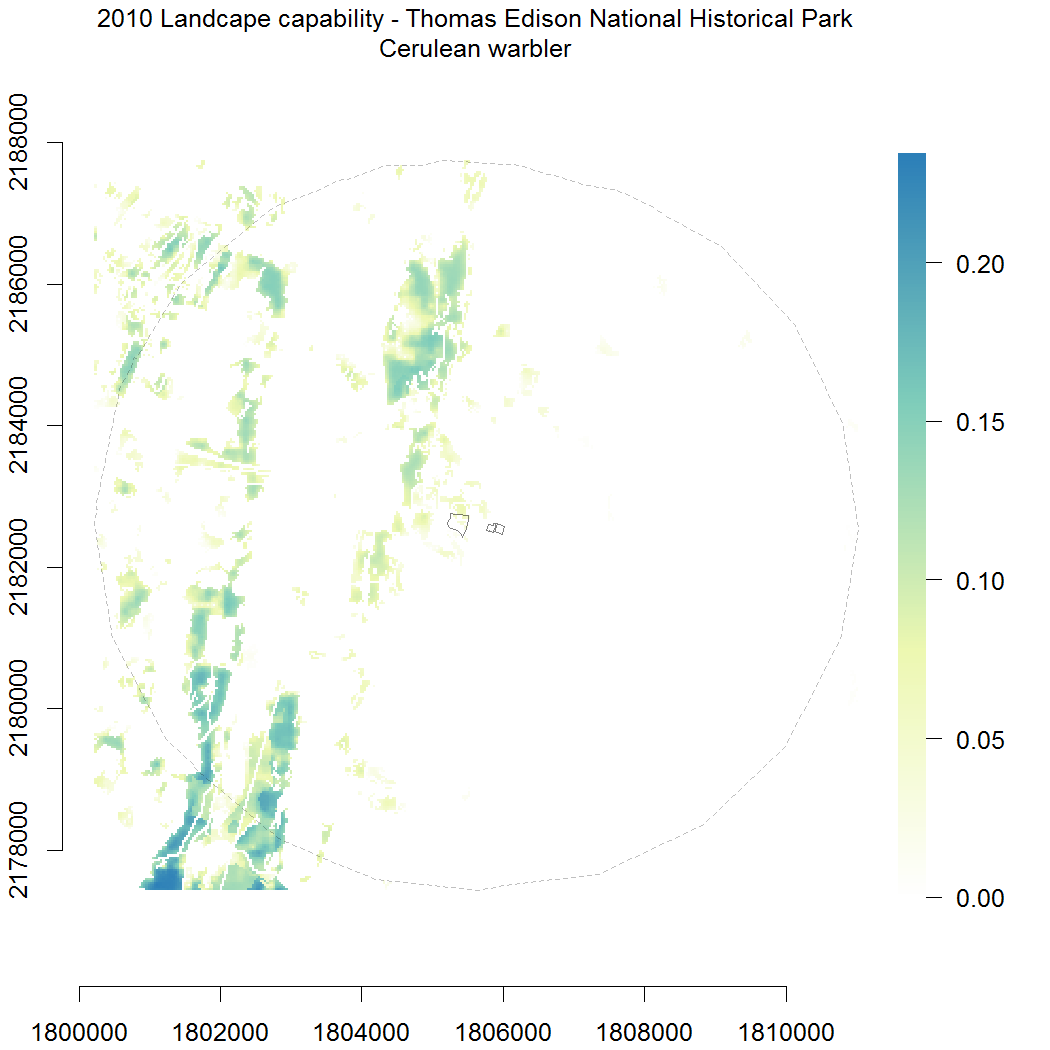
| Cerulean warbler | 0.1 | 0.13 | 31.9 | 73.0 |
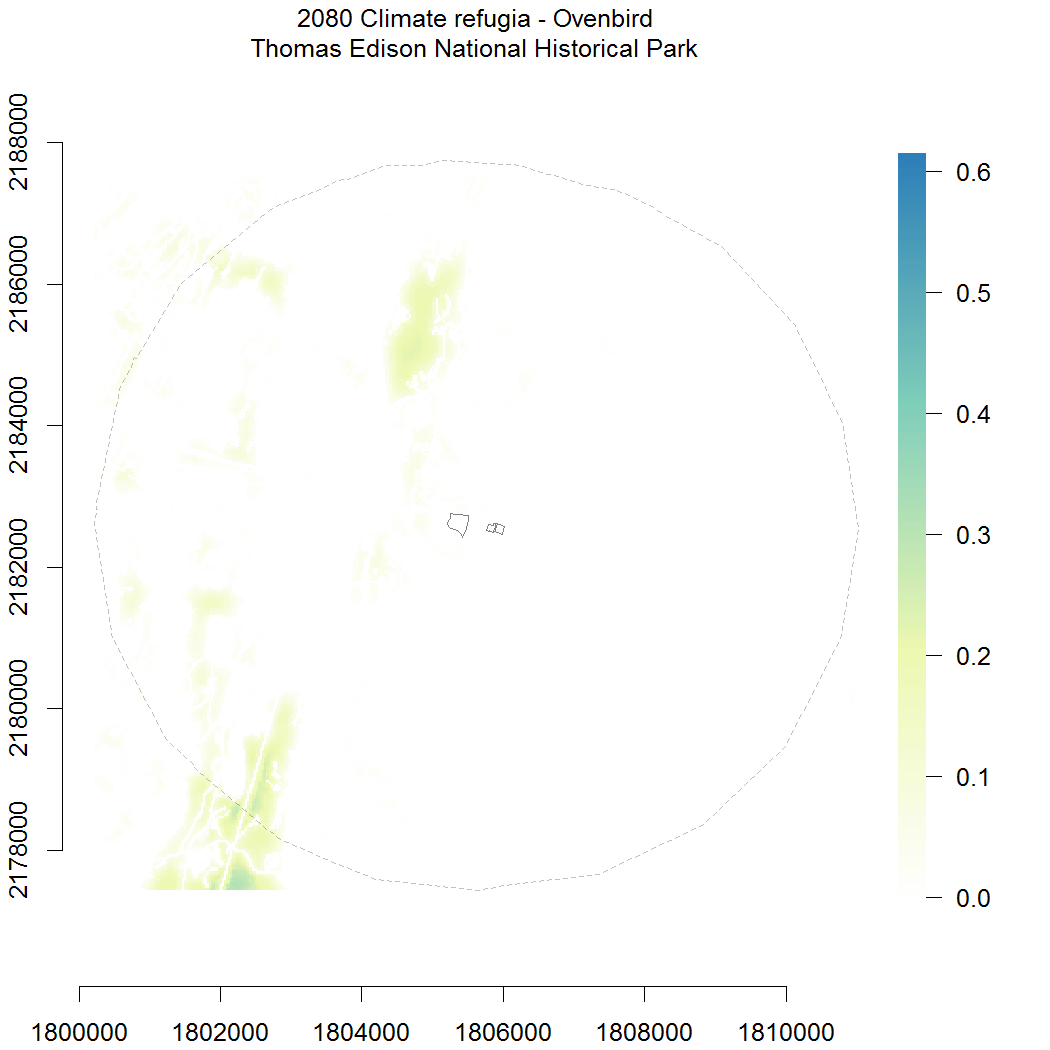
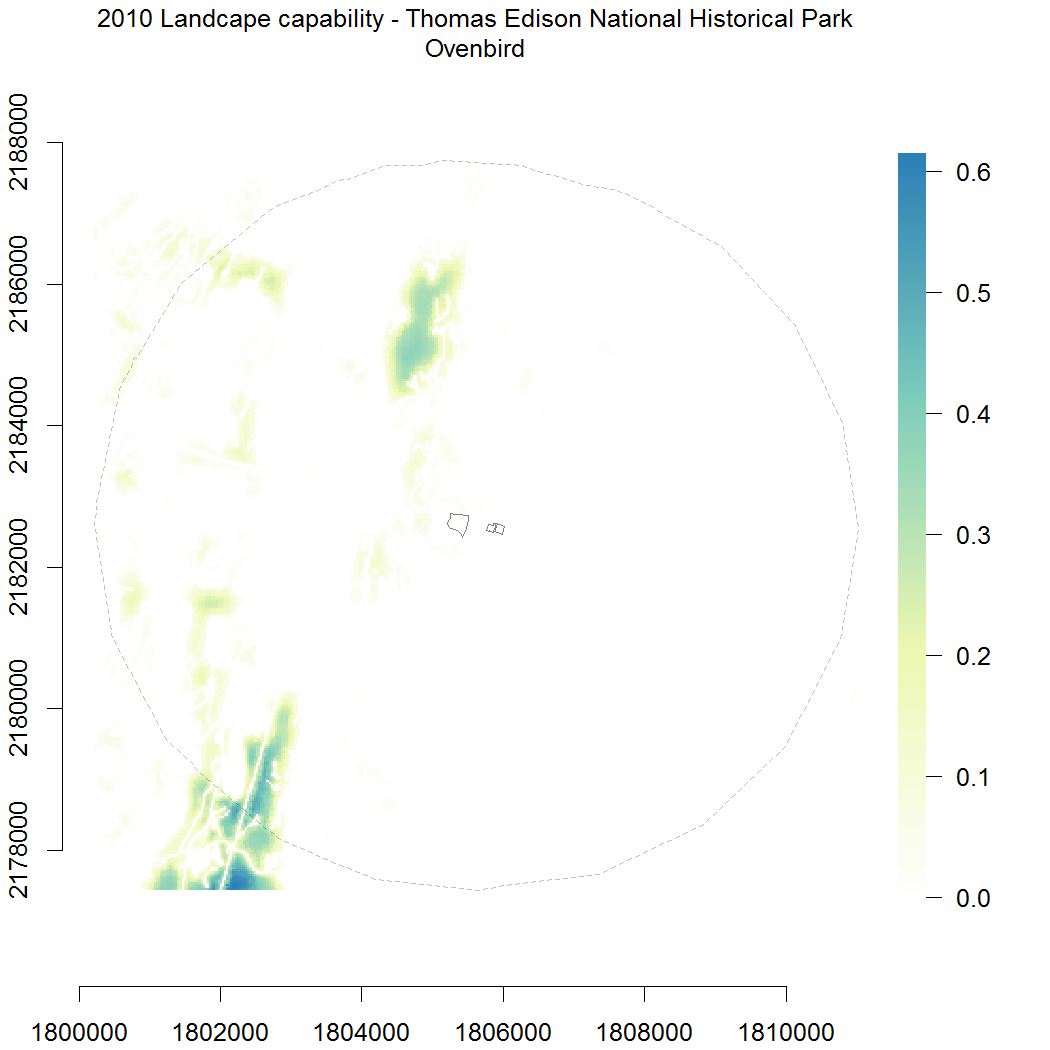
| Ovenbird | 0.05 | 0.05 | 49.8 | 88.1 |
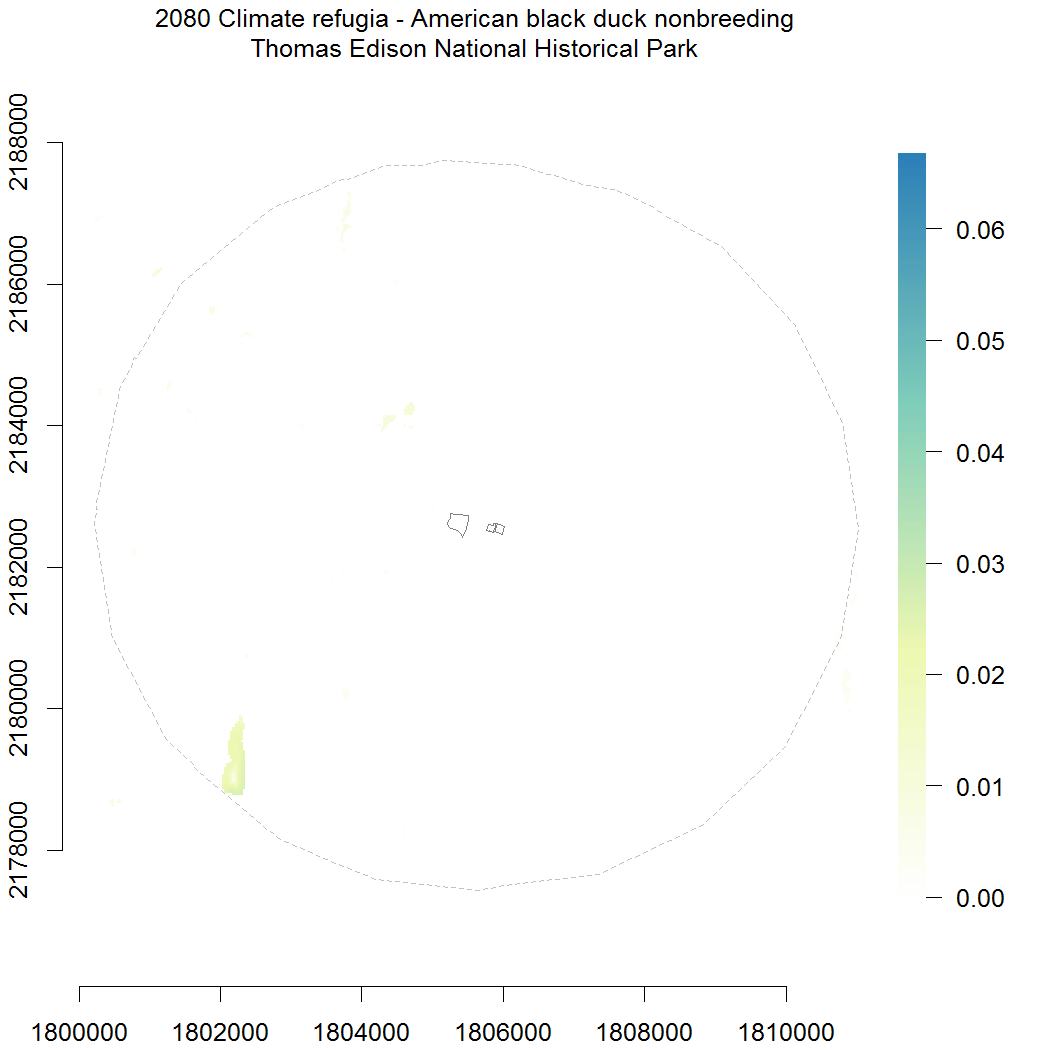
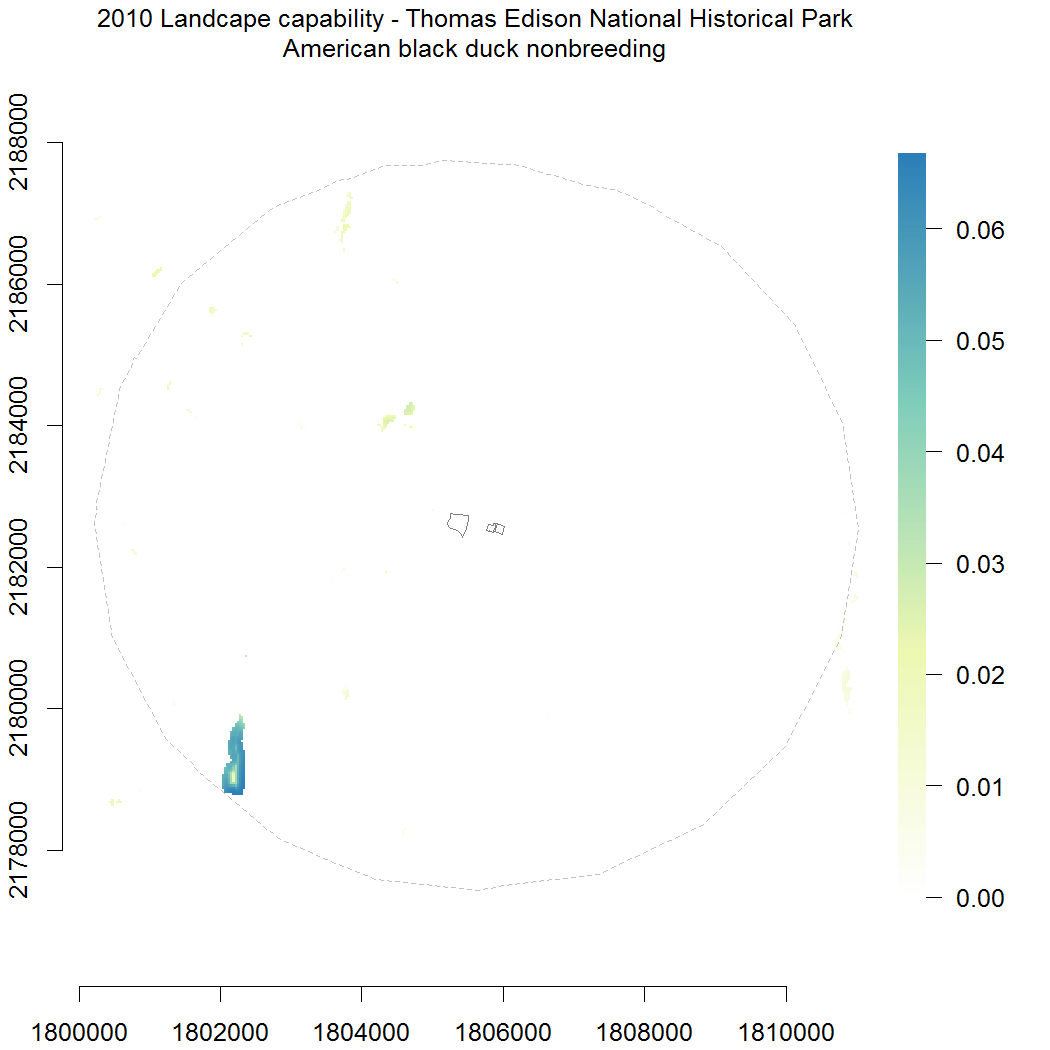
| American black duck nonbreeding | 0.03 | 0.03 | 0.6 | 1.6 |
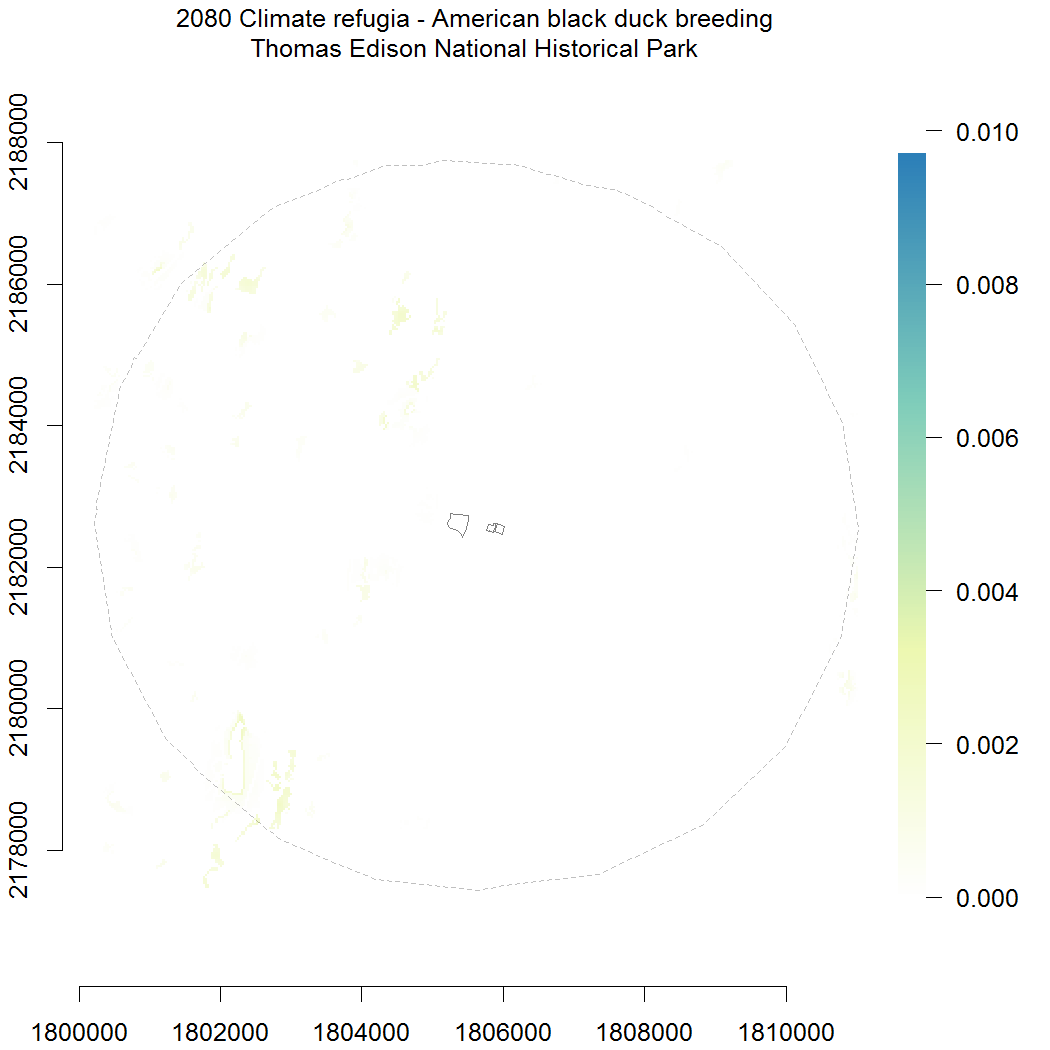
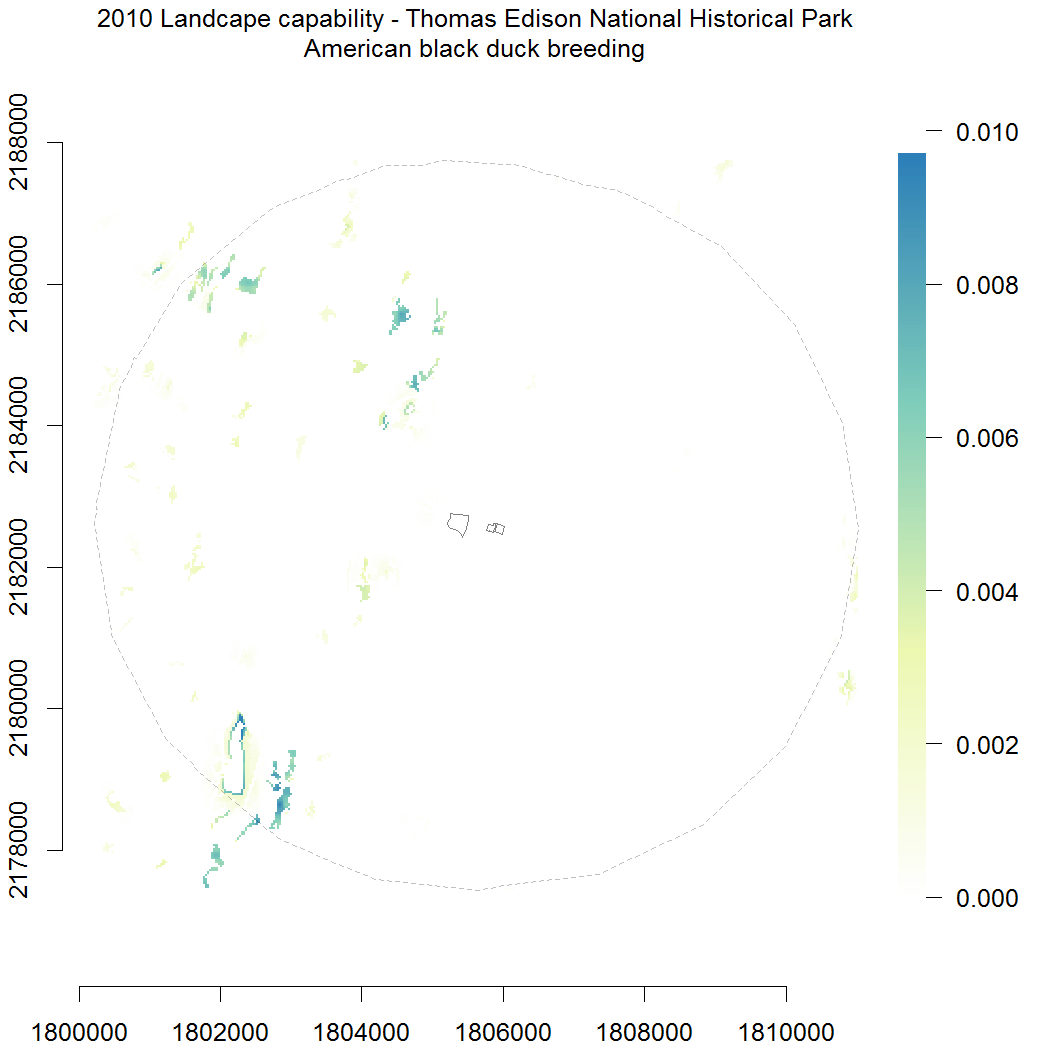
| American black duck breeding | 0.01 | 0.02 | 0.1 | 0.5 |
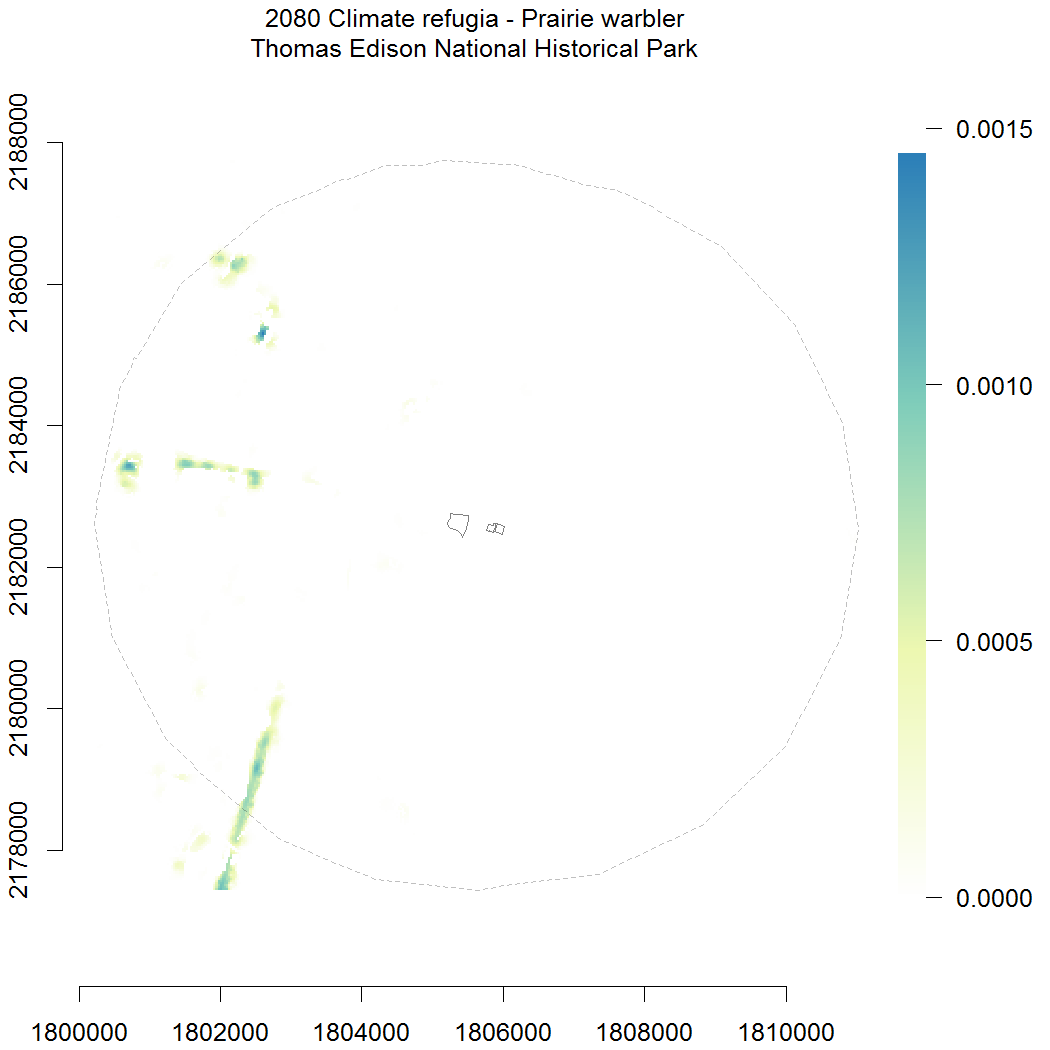
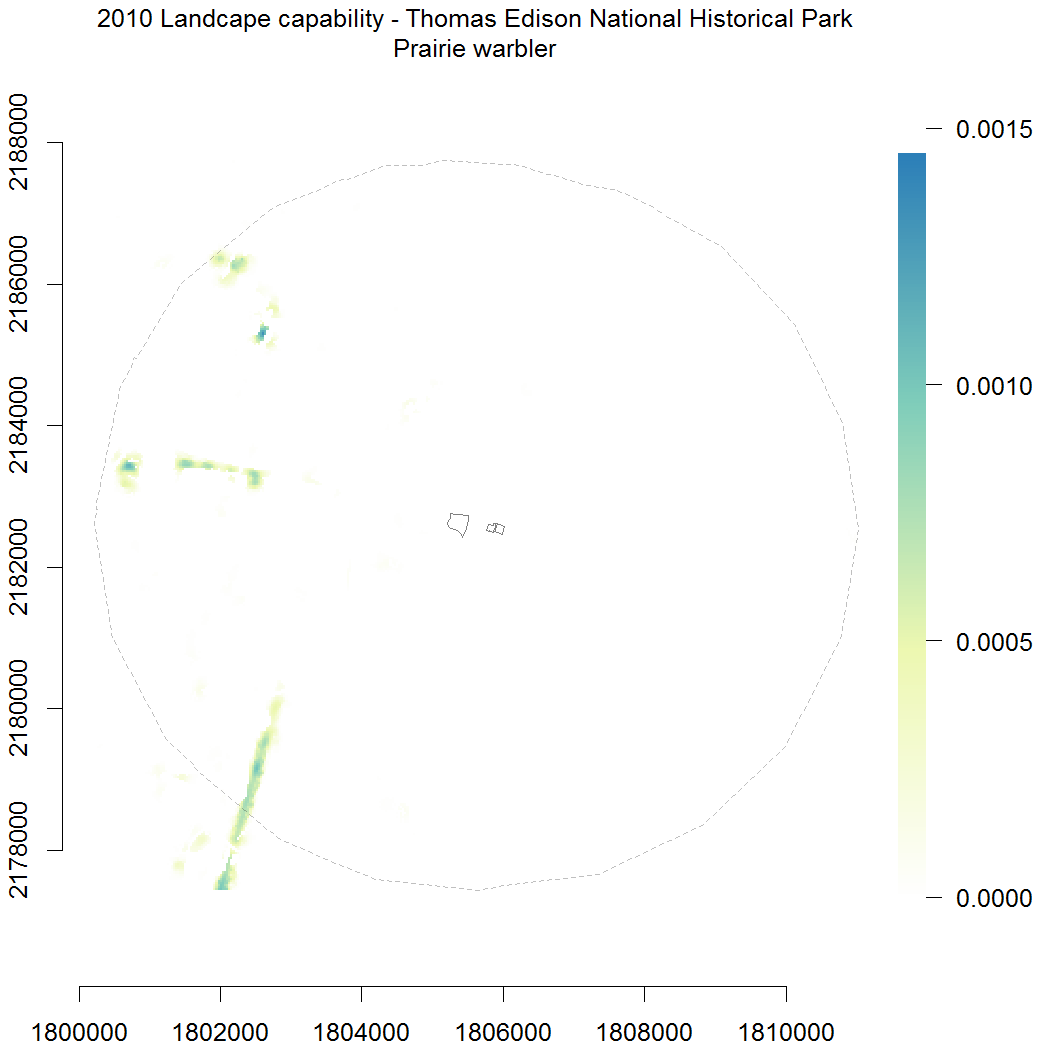
| Prairie warbler | 0.01 | 0.01 | 0.0 | 0.0 |
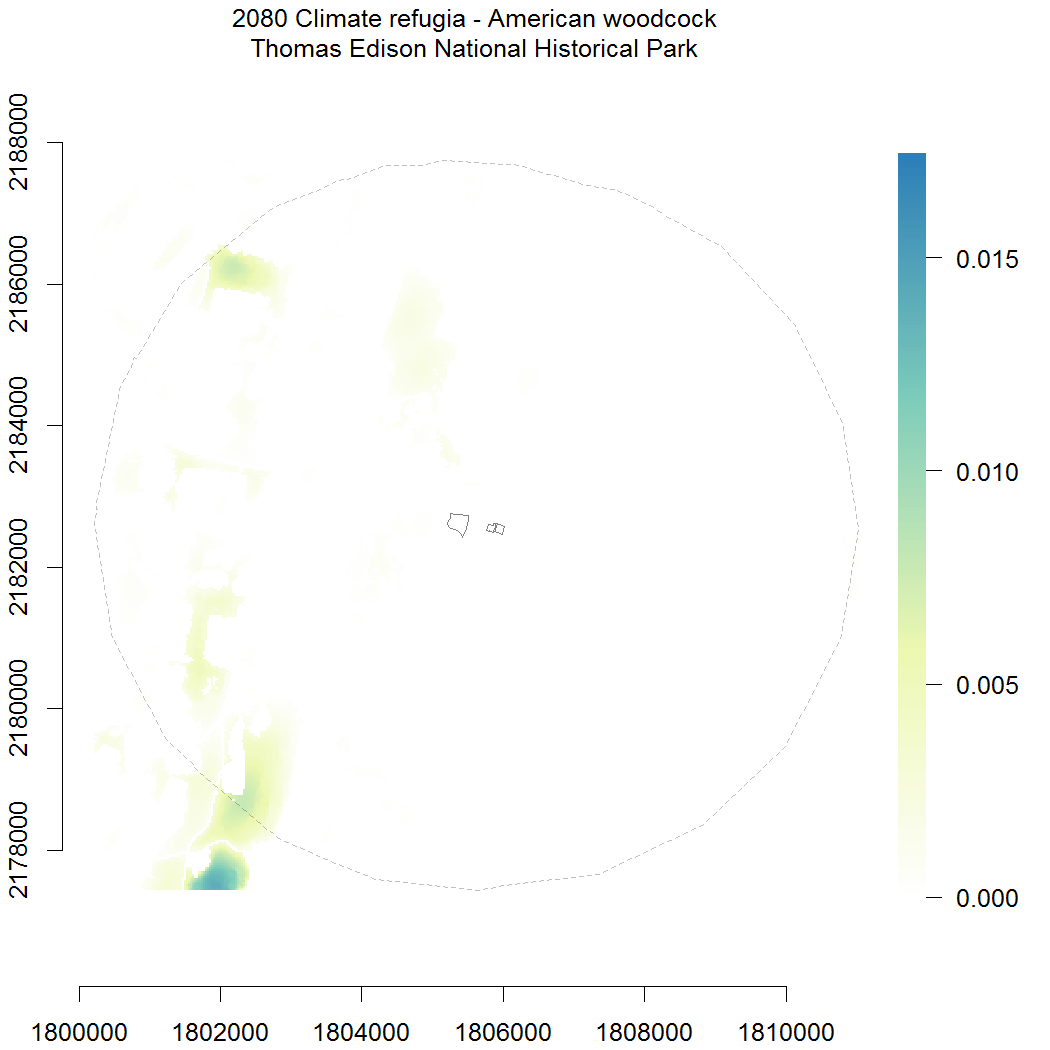
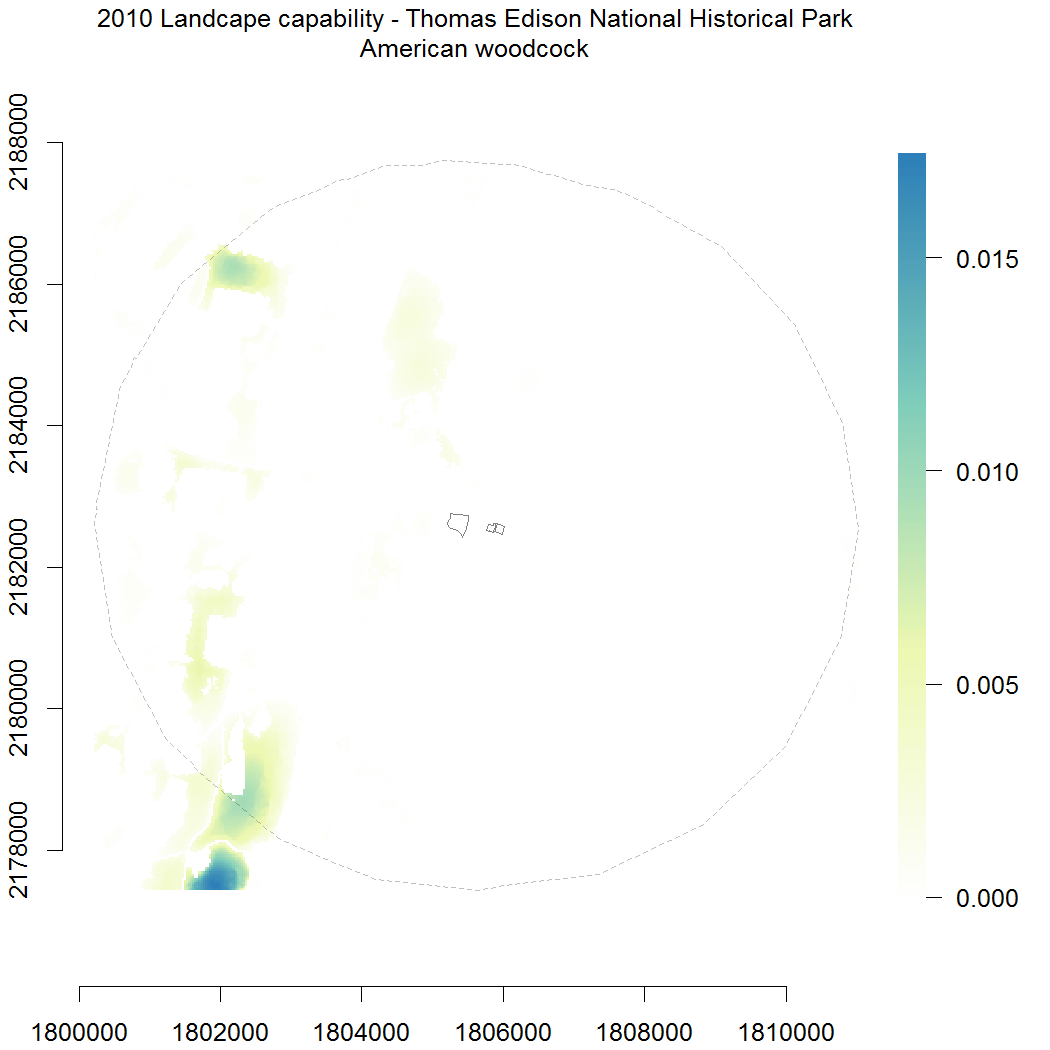
| American woodcock | 0.01 | 0.01 | 1.2 | 1.5 |
| Wood turtle | 0.01 | 0.02 | 0.3 | 0.4 |
| Bicknell’s thrush | 0 | 0 | 0.0 | 0.0 |
| Saltmarsh sparrow | 0 | 0 | 0.0 | 0.0 |
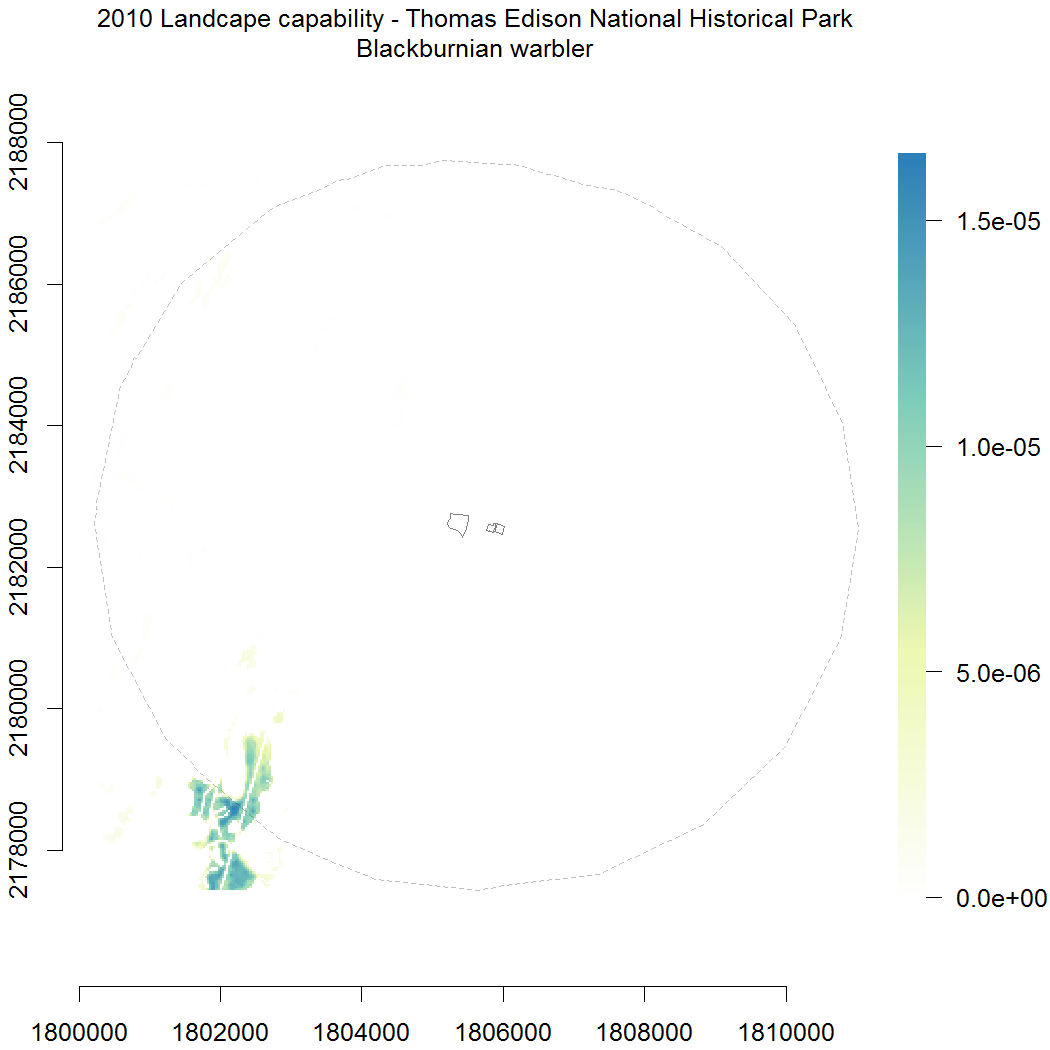
| Blackburnian warbler | 0 | 0 | 0.0 | 0.0 |
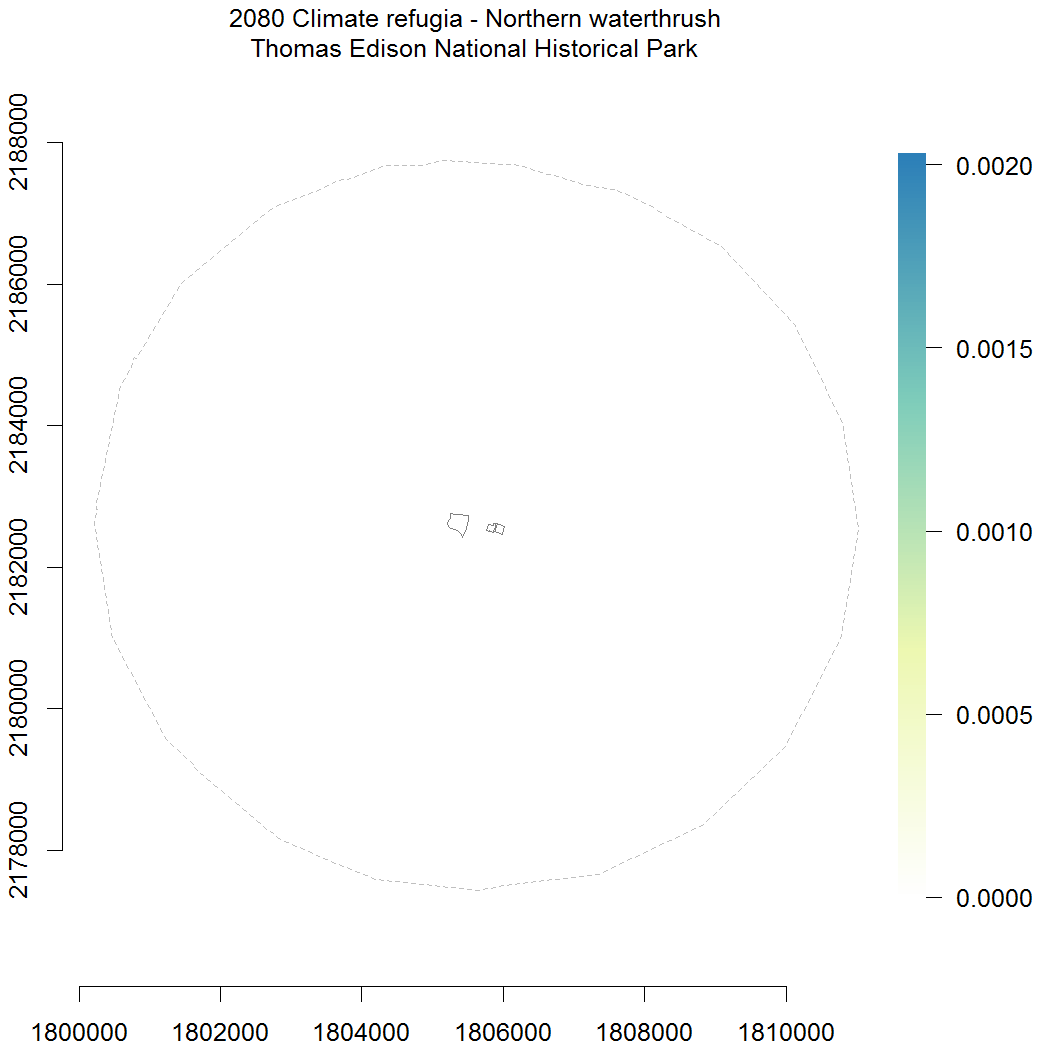
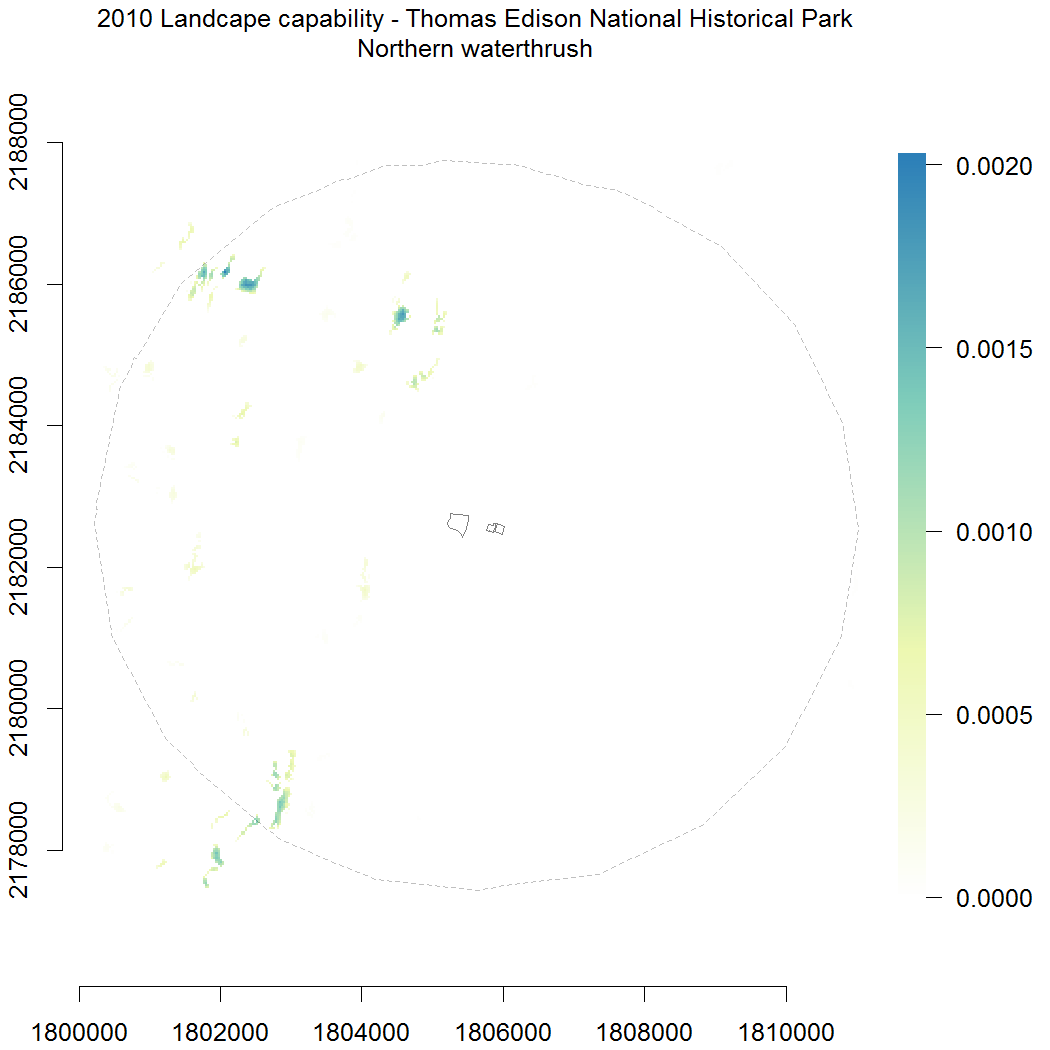
| Northern waterthrush | 0 | 0 | 0.0 | 0.0 |
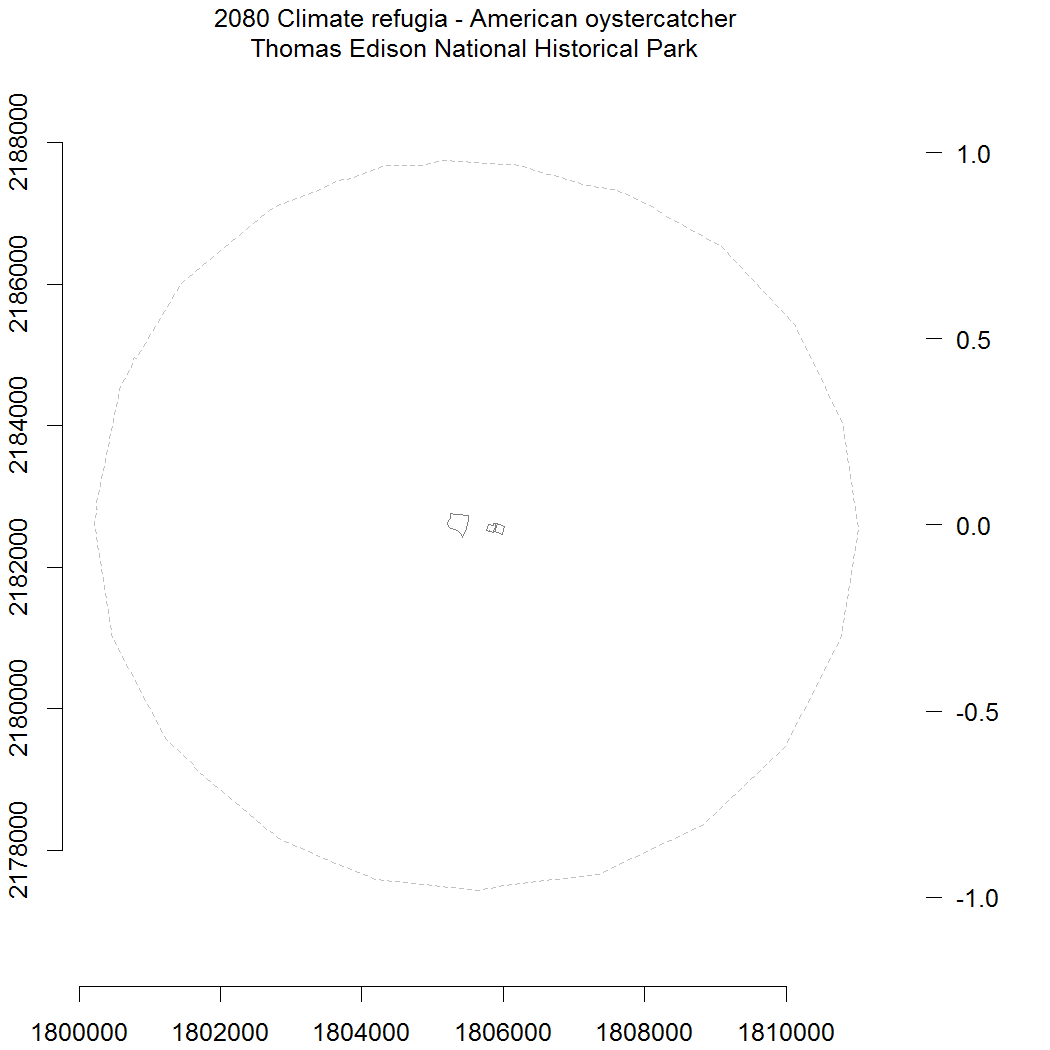
| American oystercatcher | 0 | 0 | 0.0 | 0.0 |
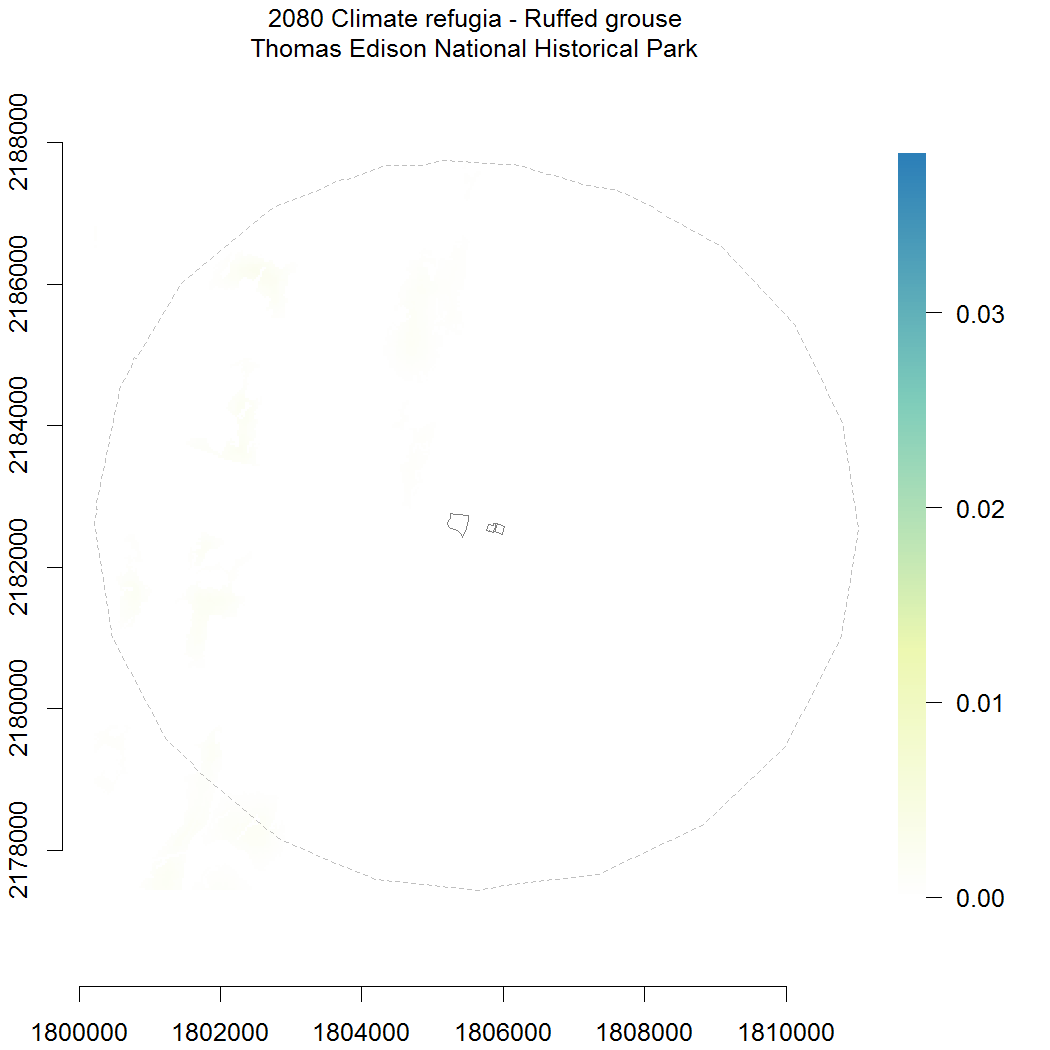
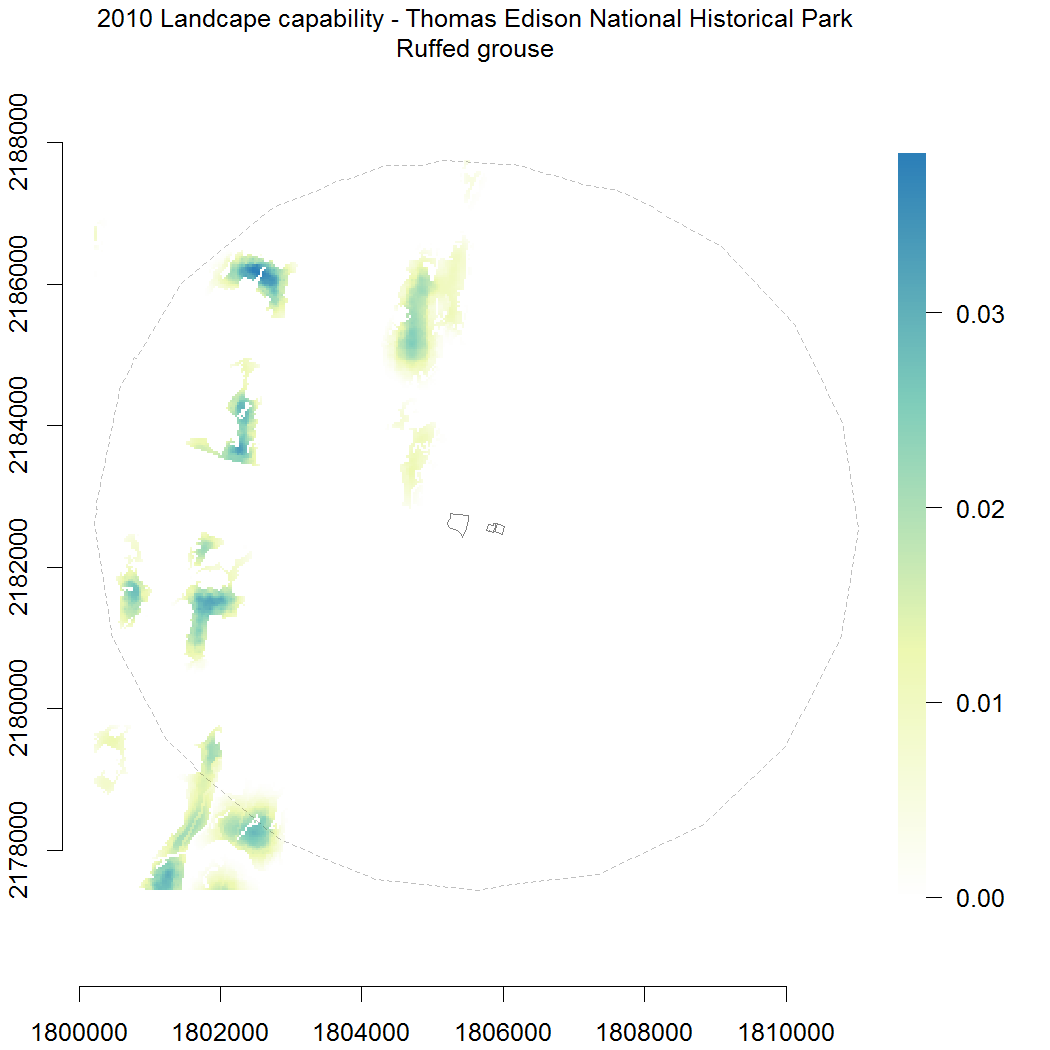
| Ruffed grouse | 0 | 0.01 | 0.3 | 5.5 |
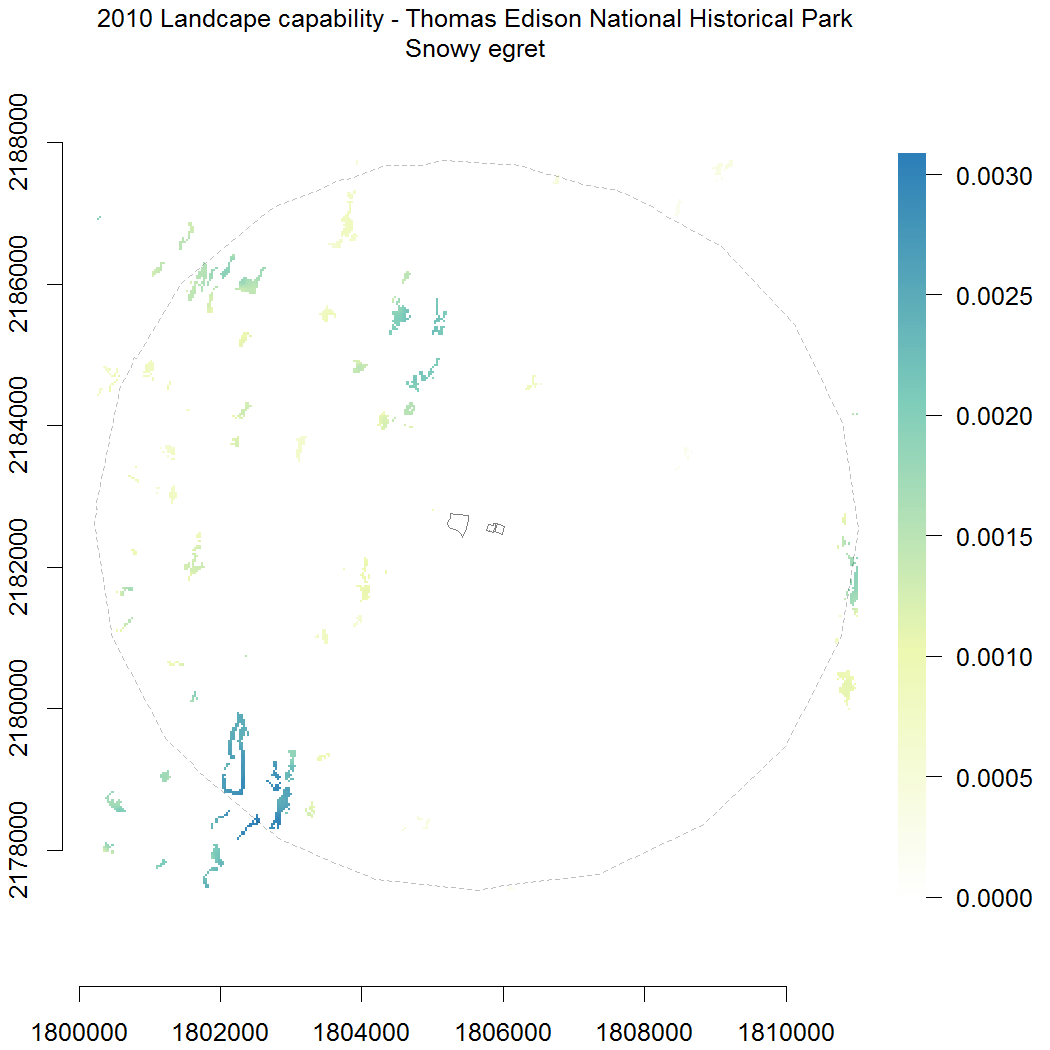
| Snowy egret | 0 | 0.01 | 0.0 | 0.2 |
| Blackpoll warbler | 0 | 0 | 0.0 | 0.0 |
| Common loon | 0 | 0 | 0.0 | 0.0 |
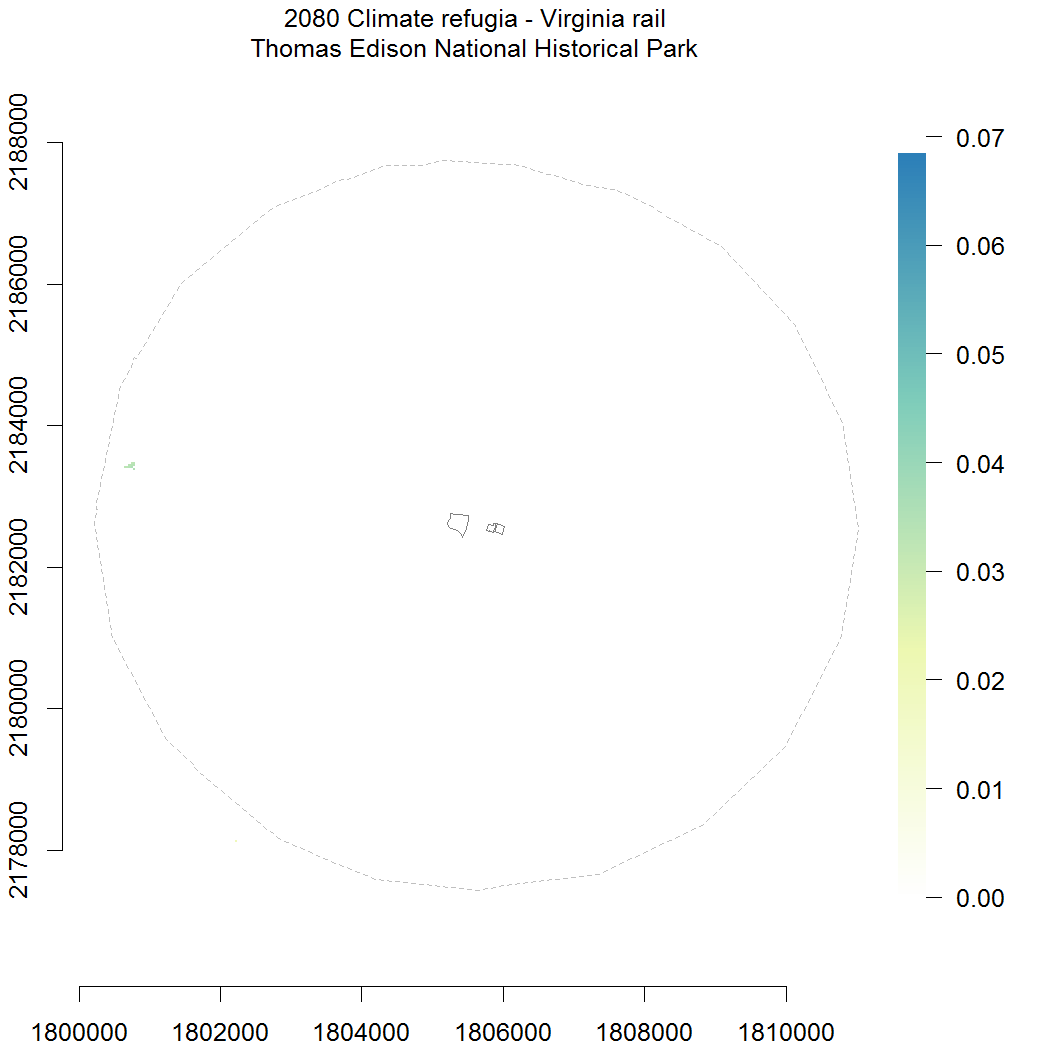
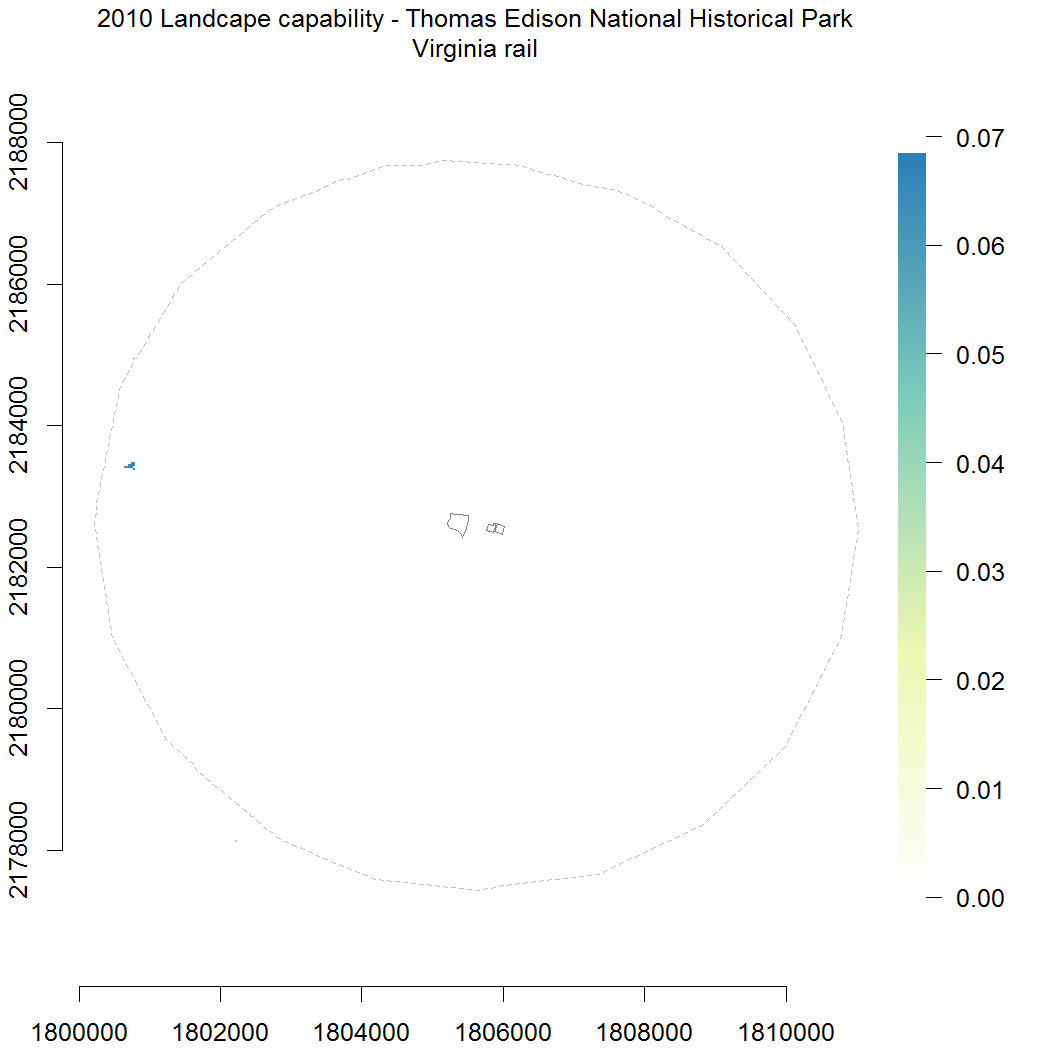
| Virginia rail | 0 | 0 | 0.0 | 0.1 |
| Piping plover | 0 | 0 | 0.0 | 0.0 |
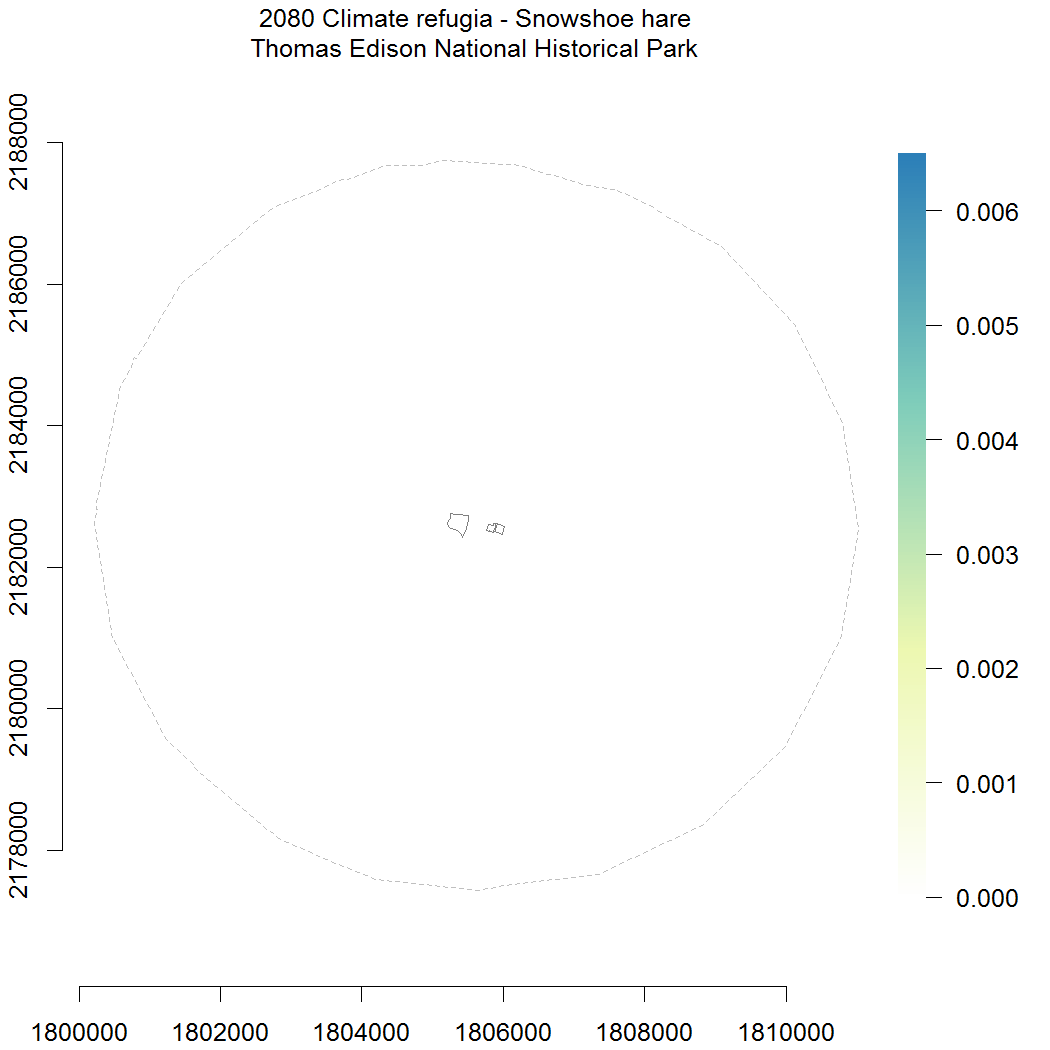
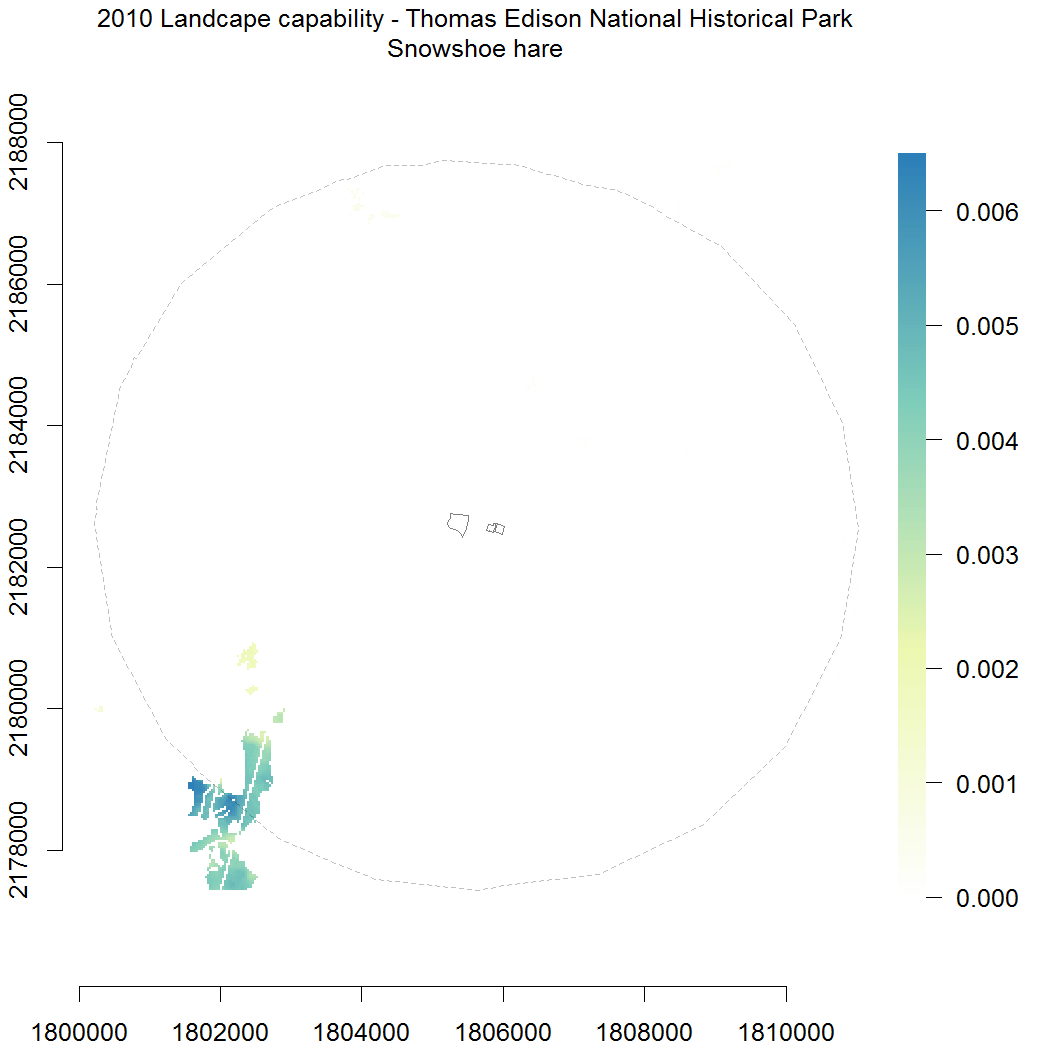
| Snowshoe hare | 0 | 0 | 0.0 | 0.2 |
| Diamondback terrapin | 0 | 0 | 0.0 | 0.0 |
| Moose | 0 | 0 | 0.0 | 0.0 |
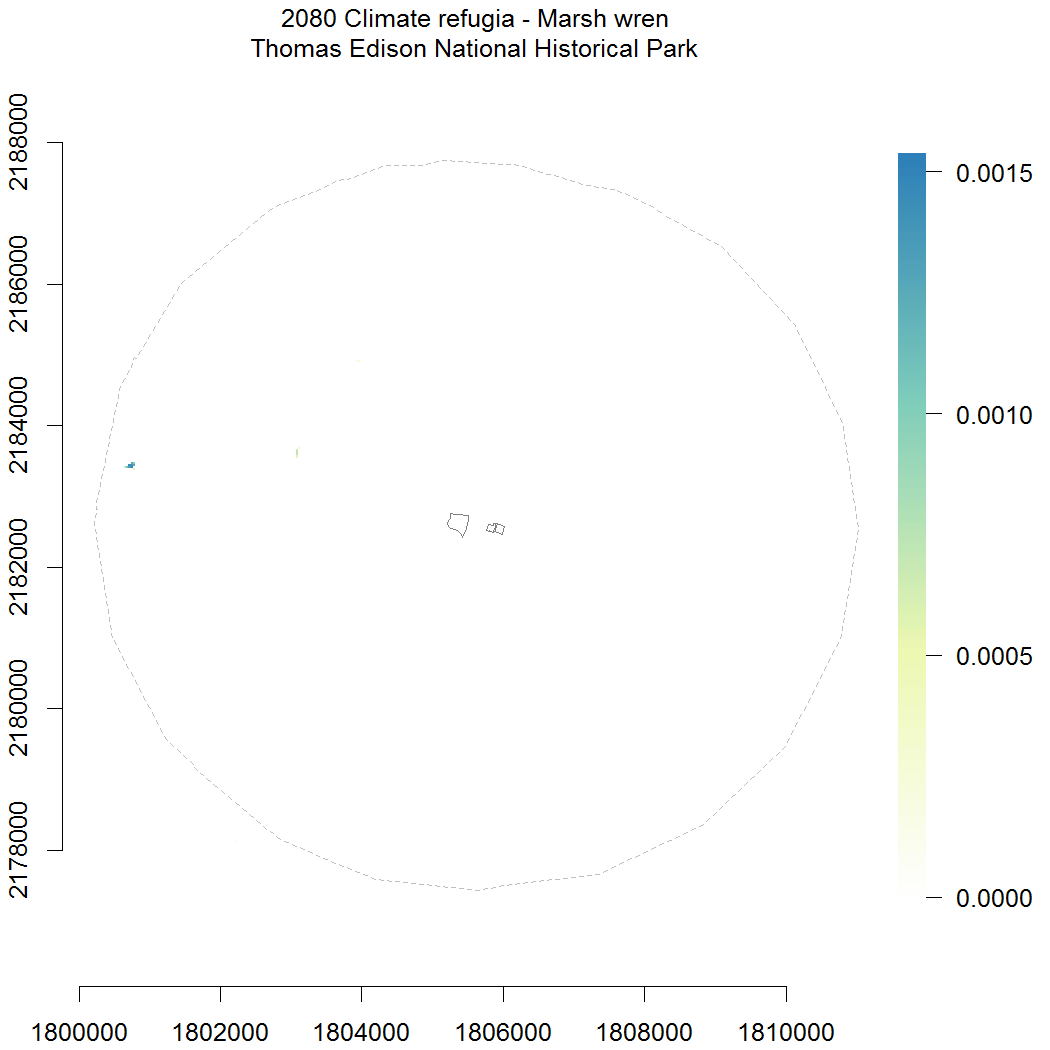
| Marsh wren | 0 | 0 | 0.0 | 0.0 |
Species This is the species model that statistics on the row apply to. They are ordered based on decreasing refugia scores. Each species is a link to the documentation for that species.
Refugia score, This score that reflects the density of refugia for a species in a given park. In particular it is how well the climate refugia for the species is represented in the park relative to the average climate refugia value for that species in the region as a whole. A value of 1 indicates that the park has (on average) the average value for the region. Higher values indicate greater concentration of climate refugia for the species within the park; a five for instance would mean that the park has 5 times the region average refugia capability for the species. Since it’s a relative density this static really reflects the quality of the park independent of it’s size. The number is a link to a map of the 2080 Climate Refugia for the species in the park and buffer.
LC score, this is calculated in the same manner as the refugia score but from LC. Higher values indicate greater expected density of the species in the park currently. The underlying link leads to a map of the 2010 LC for the species at the park.
Refugia HA and LC HA. These are indices of the ability of the park (and buffer) to support populations of the species. LC HA sum the LC across the park. For example 1 LC HA are present on 10 hectares that each have an LC of 0.1. Higher values for a park indicate ability to support larger populations now (LC HA) or in the future (Refugia HA). Since these metrics are a sum of the park’s ability to support the species bigger parks have an inherent advantage.
These statistics are based on Designing Sustainable Landscapes (DSL) models of 2010 Landscape Capability (LC) and 2080 Climate Refugia. Both of these datasets are indices of the ability of the landscape and climate to support populations of the species. They have a theoretical range from 0 to 1 but in practice the maximum values are usually below 1. Both LC and Climate Refugia are based on 2010 landcover but differ in the climate suitability; in LC the climate suitability is derived from 2010 climate variables while climate refugia is based on 2080 climate, while limiting the extent of the species to areas where the climate was suitable in 2010. For a full description of the species modeling process see the documentation. The underlying GIS data is available at http://umassdsl.org - use the version 3 species data links.
The statistics are calculated on the focal park with an additional 5 km buffer. The buffer was added so that even with small parks there’s sufficient data to characterize the species.